


Let’s be honest. Most businesses don’t start tracking carbon emissions because they want to. They do it because someone asked.
A new contract. A big-name customer. A tender with a sustainability clause.
More and more, your customers want proof that you’re tracking and reducing your environmental impact. If you can’t show them the data, they’ll find someone who can.
That’s why we built the Fleet Emissions Dashboard, a simple way to report, reduce and stay ahead of rising expectations.
Stay Competitive. Stay in the Conversation.

The Fleet Emissions Dashboard gives you clear, job-level insight into your fleet’s carbon impact, allowing you to:
- Prove your performance with downloadable reports for customers or stakeholders.
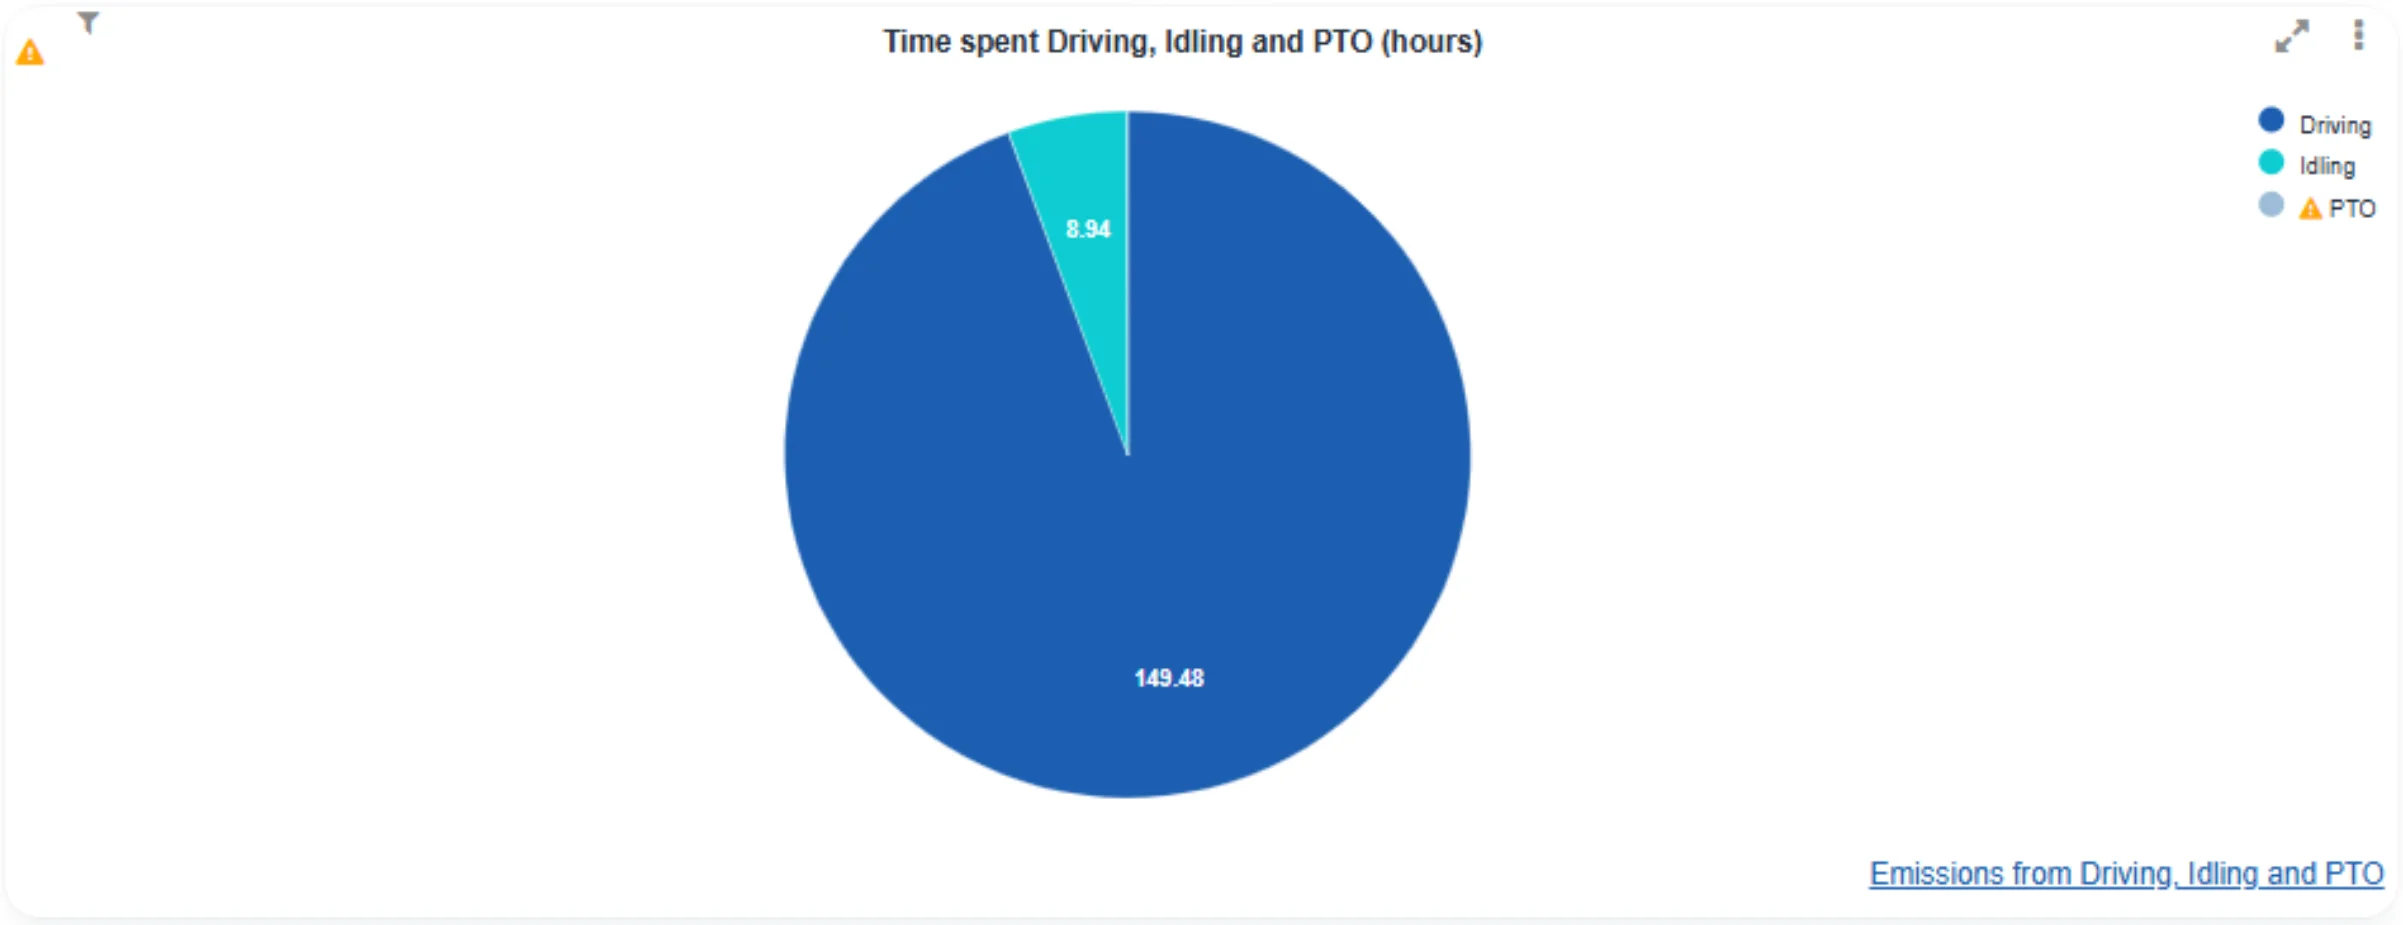
- See what’s driving emissions, from inefficient routes, vehicles to driving behaviour such as idling.
- Track trends over time and measure the effect of operational changes.
- Spot high-cost behaviours and reduce fuel waste by reducing mileage per job and journey.
This isn't about chasing awards or polishing your image. It’s about protecting your margins, staying competitive, and being able to say, “Yes, we’ve got the numbers.”
Why This Matters Now

Until now, emissions data were often buried in a mix of reports (assuming you had them!). You’d need to export journey data, match it to jobs, calculate CO₂ manually, and hope it was accurate.
That’s not scalable. And when a client emails asking for emissions data next week, “I’ll get back to you” won’t cut it.
Our Fleet Emissions Dashboard pulls it all together:
- Emissions per job, customer, vehicle or job type
- Driving behaviours linked to excess fuel use
- Clear visuals and exportable insights
You don’t need to be an environmental expert. You just need to be ready.
“This dashboard makes environmental reporting part of your day-to-day operations, not an afterthought. It’s about keeping up with what customers expect.”
— Alekhya Ankarapu, Product Manager for Data & Analytics at BigChange
Built for Today, Designed for What’s Next
While the dashboard already delivers detailed CO₂ and mileage data, we’re just getting started. We’re exploring:
- Fuel consumption and cost analysis (based on mileage and MPG)
- EV tracking
- Smarter ways to enter and validate CO₂ data
We know environmental reporting might not feel like a priority right now. But the landscape is changing. Customer expectations, supply chain standards and ESG (Environmental, Social, and Governance) requirements are moving fast, and the businesses that get ahead of it now will win more work in the long run.
“You don’t need to care about emissions. But your next customer might. This dashboard makes sure you’re ready when they ask.”
— Jonathan Isaacs, Product Marketing Manager at BigChange
Who’s It For?
If you run a fleet and you want to:
- Keep winning contracts that ask for sustainability data
- Avoid losing out to greener-looking competitors
- Cut fuel costs by identifying avoidable emissions
- Track performance over time with real, usable data
…then this is for you.
Try It Today
The Fleet Emissions Dashboard is live in your BigChange system right now.
👉 Existing customers: Read the Help Guide → TBC
(Find out what data’s needed and how to start using the dashboard in your day-to-day.)
Not yet using BigChange?
👉 See the Fleet Emissions Dashboard in action → https://www.bigchange.com/demo
(We’ll walk you through what it does and how it can help you stay competitive.)


